 | ||||
| photo taken by Andy captured trhe neon glow illuminating one of Australia's beaches |
Diagram 1 : Common clear-water species
that produce phycourobilin-rich forms of phycoerythrin have stronger
fluorescence with blue excitation.
What
is fluorescence?
Fluorescence is the emission of light by a substance that has absorbed light. In most cases, the
emitted light has a longer wavelength, and therefore lower energy, than the absorbed radiation.
The most striking example of fluorescence occurs when the absorbed radiation is
in the ultraviolet region of the spectrum, and thus invisible to the human eye, while the emitted
light is in the visible region, which gives the fluorescent substance a
distinct color that can only be seen when exposed to UV light.
How
to measure fluorescence?
By using a
chlorophyll sensor which is known as fluorometer. As all phytoplankton have
chlorophyll A, a chlorophyll sensor can be used to detect these organisms
in-situ. However, as a chlorophyll sensor assumes all algae and cyanobacteria
have the same levels of chlorophyll A, it only provides a rough estimate of
biomass. It also cannot be used to identify specific species.
Chlorophyll is measured in
micrograms per liter (µg/l). Chlorophyll sensors rely on fluorescence to
estimate phytoplankton levels based on chlorophyll concentrations in a sample
of water. Fluorescence means that when the chlorophyll is exposed to a
high-energy wavelength (approximately 470 nm), it emits a lower energy light (650-700
nm). This returned light can then be measured to determine how much chlorophyll
is in the water, which in turn estimates the phytoplankton concentration. These
estimates are then used to develop parameter limits for bodies of water. As an
example, the New Hampshire Department of Environmental Services provides the
following chlorophyll guidelines for river quality: a chlorophyll measurement
below 7 µg/l is within a desirable range. 7-15 µg/l is less than desirable,
while over 15 µg/l is considered problematic.
Diagram 2: Hand-held fluorometer
(Picture taken from google image)
Diagram 3: Spectroscopy
(Picture taken from google image)
Diagram 4: For fluorescence
spectroscopy the equivalent to a single beam spectrometer has a few slight
modifications in that the detector is perpendicular to the source, and that
there is an additional monochrometer that can be used to vary the wavelength
detected. In this fashion, the source light is unable to interfere with the
fluorescence light being measured, and the fluorescent light produced can be
separated and described as the resulting wavelengths of fluorescence as a
function of incident light.
Where
do we use fluorometer on?
Plants, algae and phytoplankton
Why
do we measure the fluorescence?
- - Steady state of fluorecence often used for the investigation of energy transfer between pigments components
- - To determine the amount of phytoplankton and algae which act as bioindicator.
Diagram 5: A spectacular “red tide” bloom (non-toxic) of Noctiluca scintillans in New Zealand. (Photo by M. Godfrey)
- - To Prevent Algal Blooms
Under the right conditions, algal blooms can last one week to an entire summer, despite the short, few-day life span of phytoplankton 11. A single bloom will only last one to two weeks, as the phytoplankton population will die without the proper oxygen and nutrient levels. However, if the water conditions stay favourable, successive blooms can occur and appear to be one continuous population. Algal blooms are most common in late summer and early fall.
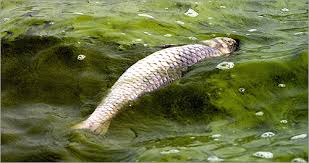
Diagram 6: Fish died due to lack of oxygen ( Google image)
- - Oxygen Depletion and Fish Kills


No comments:
Post a Comment