Density of microalgae is widely tested all around the world as it is important as an indicator for a lake or sea to be determine whether the density is too much ( nutrient overload) or too less ( lack of nutrient ) which will lead to the healthiness of the sea. There are several method of calculating the density, for example Dry Weight method ( used to determine the density by weight ), Dilution method ( by using the haemocytometer to count the microalgae) and the most expensive method which is spectrophotometer ( by detecting the light reflection by chlorophyll a ).
Objectives
To determine the density of the stock cultureTo determine whether which method has the highest accuracy
Materials and methods
A) Dry Weight method
Picture 1: Amphora sp
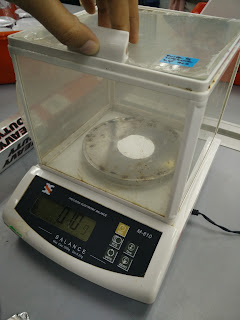
Picture 2: Weighing the filter paper (initial weight)
Picture 3: Filtered an exact volume on pretared glass microfibre filters by using a bilchner setup connected to a vacuum pump (Control filters : Seawater)
Picture 4 : The filtered paper are washed with ammonium formate (0.5M) to remove salts.
Picture 5: The filtered paper are sealed in the aluminium foil and dried at the oven at 100 degree Celsius for 4 hours to volatilize the ammonium formate
*Repeat the steps from picture 2 till picture 5 by using the Amphora sp
*After 4 hours, the filtered paper are weighted.
B)Chlorophyll Analysis method
Picture 6: 50ml sample are filtered through the pretared glass microfibre filters.
Add 3 to 5 drops of MgCO3 to the sample as it is being filtered.
Picture 7: Edges of filter which are not coated with residue being trimmed away.
Picture 8: The filter with 5ml acetone are grinded for 1 minute. After that, 5ml more of acetone are being added and grinded for another 30 seconds.
Picture 9: Extract are done and refrigerated in the dark for an hour.
Picture 10: After an hour, the sample was centrifuged at 3000rpm for 10 minutes.
Picture 11: The absorbance of the sample extract are measured by Spectrophotometer at 750nm, 664nm, 647nm and 630nm.
Picture 12: Glass Cuvettes.
Picture 13: Delicate Task Wipers
Picture 14: The extract are inserted by using a droplet at the volume of 5ml into the Cuvette.
Picture 15: The Cuvettes are wiped before inserted into designated place
Picture 16: The Cuvettes are inserted into the spectrophotometer.
Picture 17: The program are set and ready to go.
Picture 18: Results are obtained.
C) Dilution method
Picture 19: 6 test tube are prepared
Picture 20: Stock culture are inserted in 5 test tube which are in different volume, 1 ml, 2 ml, 3 ml, 4 ml, and 5 ml.
*5ml stock culture does not need to be filled with seawater*
Another 1 test tube are filled in with 5ml of seawater as constant, the rest are filled with seawater until 5 ml of the total volume
Picture 21: Test tube are labeled
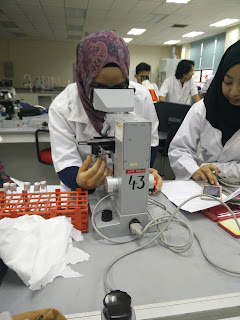
Picture 22: Haemocytometer are used to count the numbers of Amphora under microscope.
Results
1)Estimation of Dry weight
Weight(g)
|
Filter with seawater
|
Filtre with microalgae
|
Before
|
0.1
|
0.1
|
After
|
0.10
|
0.11
|
2) Chlorophyll analysis
Wavelength(wm)
|
630
|
647
|
664
|
750
|
Absorbance
|
0.0432
|
0.0567
|
0.0431
|
0.0204
|
3)Optical density analysis
%
|
Cell/ml
|
OD
|
0%
|
0
|
0
|
20%
|
9 000
|
0.0732
|
40%
|
150 000
|
0.1622
|
60%
|
260 000
|
0.2689
|
80%
|
360 000
|
0.2919
|
100%
|
1 000 000
|
0.3775
|
Discussion
Due to the natural characteristic of Amphora sp. to be a benthic microalgae, it is common for it to easily clump together and descend to the bottom of a container which may affect a reading when the sample is not continuously mixed or stirred. In each method, the Amphora sp. culture is constantly stirred to achieve a more accurate result.


Nice job guys!
ReplyDeleteComments:
- for graph, u may use log10 to transform the density data, this will give less gap between OD n cell density.
- u may put second y-axis (on right) for OD scale.
Well done!